
El Niño is a climate variation which results from the coupling of intense atmospheric and oceanic phenomena, mainly in tropical regions. During winter when it appears, El Nino has weather impacts around the globe.
In the ocean El Niño is characterized by a strong warming of surface and subsurface waters from the central Pacific to the coast of Peru and Ecuador.
At the surface, the warm temperature anomaly, about 1-2°C, is one of the manifestation of an ocean/atmosphere interaction that perturbs oceanic currents, the position of Inter-Tropical Convergence Zone (ITCZ), the trade winds and also the atmospheric general circulation.
All the tropical belt of the globe suffers a climatic upheaval that causes regionally intense precipitations or exceptional droughts.
These climatic changes have dramatic consequences on the environment and human activities.
Some weak El Niño events have occurred in the last decade (in 2002, 2006 and 2009), but the last major El Niño happened during the winter of 1997-1998.
An El Niño event affects tropical regions in the first place and is monitored by following the evolution of Equatorial Pacific temperature in surface and subsurface.
More information on El Niño: http://www.meteofrance.fr/climat-passe-et-futur/comprendre-le-climat-mondial/el-ninola-nina
Mercator Ocean monitors the temperature anomalies in the Pacific Ocean:
With ocean general circulation models forced to remain close to the satellite and in situ[1] observations of the ocean we can monitor variations of temperature especially along the equator in the Pacific Ocean and we can compare them with the huge 1997-98 El Nino event.
Mercator Ocean, French center of ocean analyses and forecasts, develops and operates numerical systems to describe and predict the state of the ocean in 3D. We provide the ocean component of the Météo-France coupled ocean/atmosphere system, and then Météo-France develops seasonal forecasts over the coming quarter.
More information about the seasonal forecasts at Météo-France: http://www.meteofrance.fr/climat-passe-et-futur/la-prevision-saisonniere
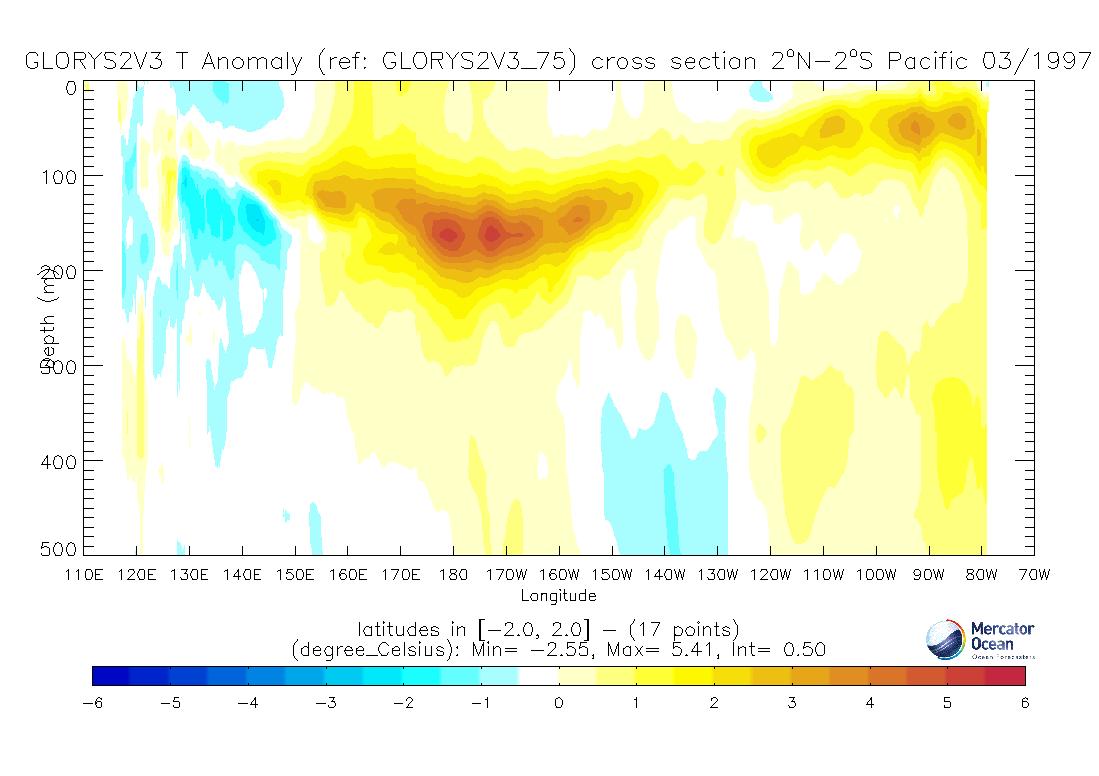
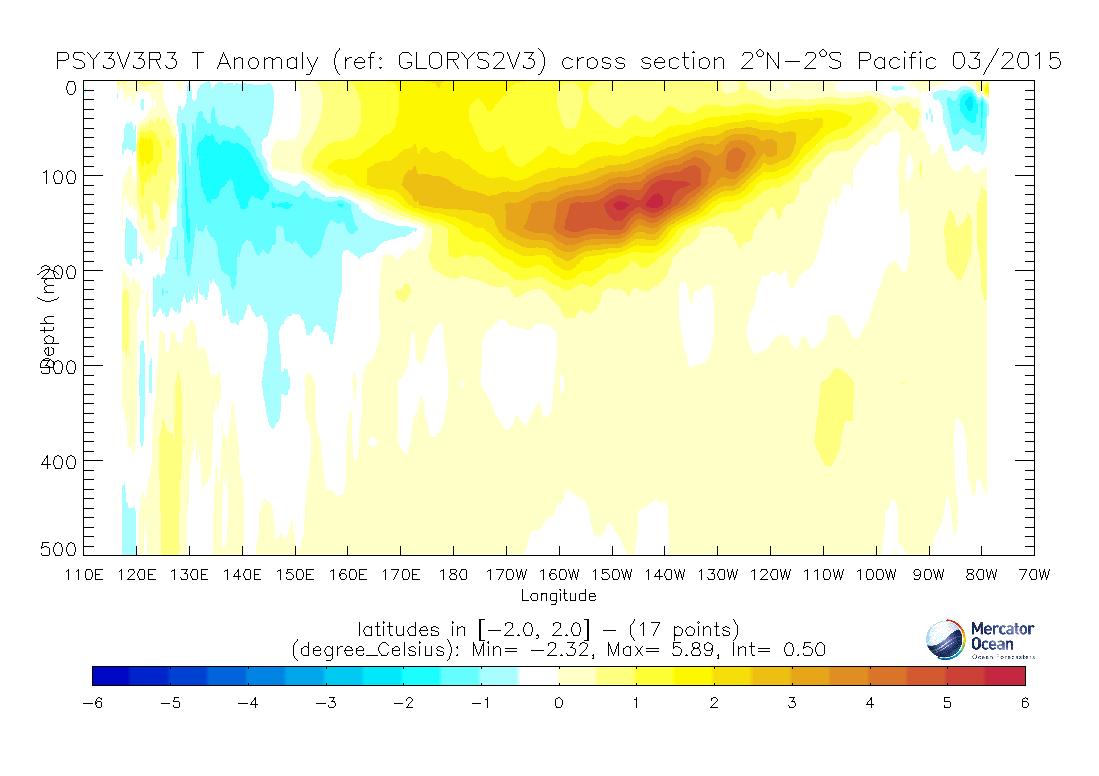
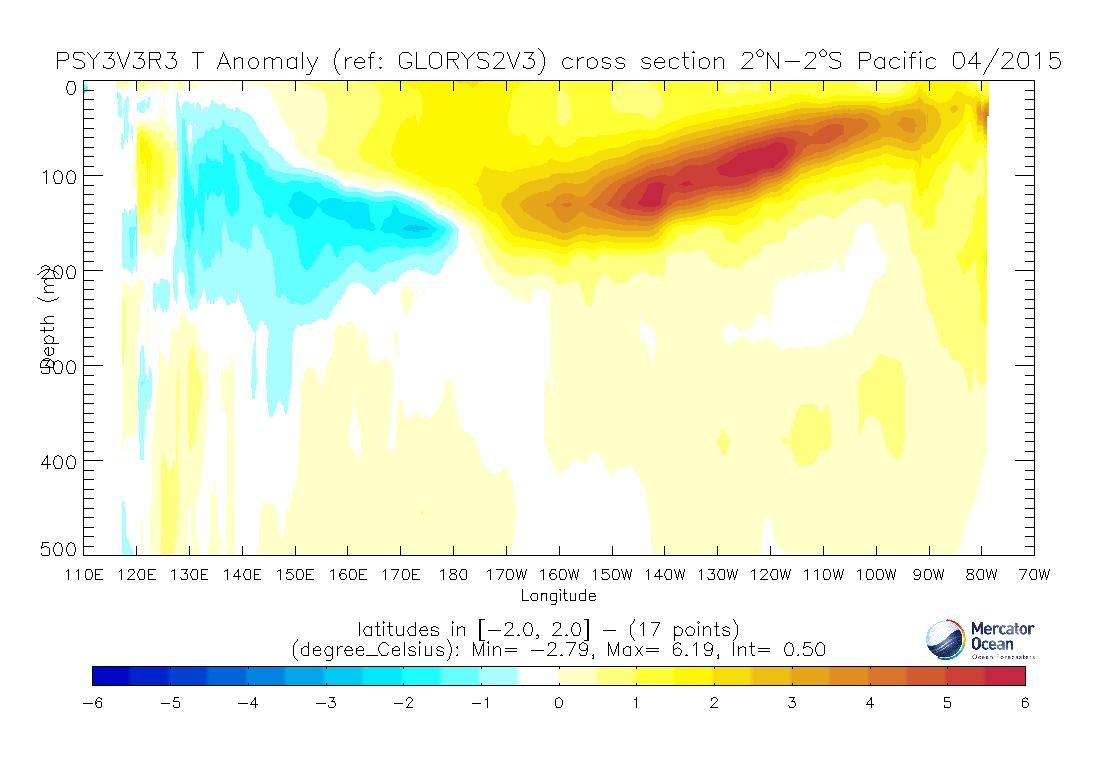
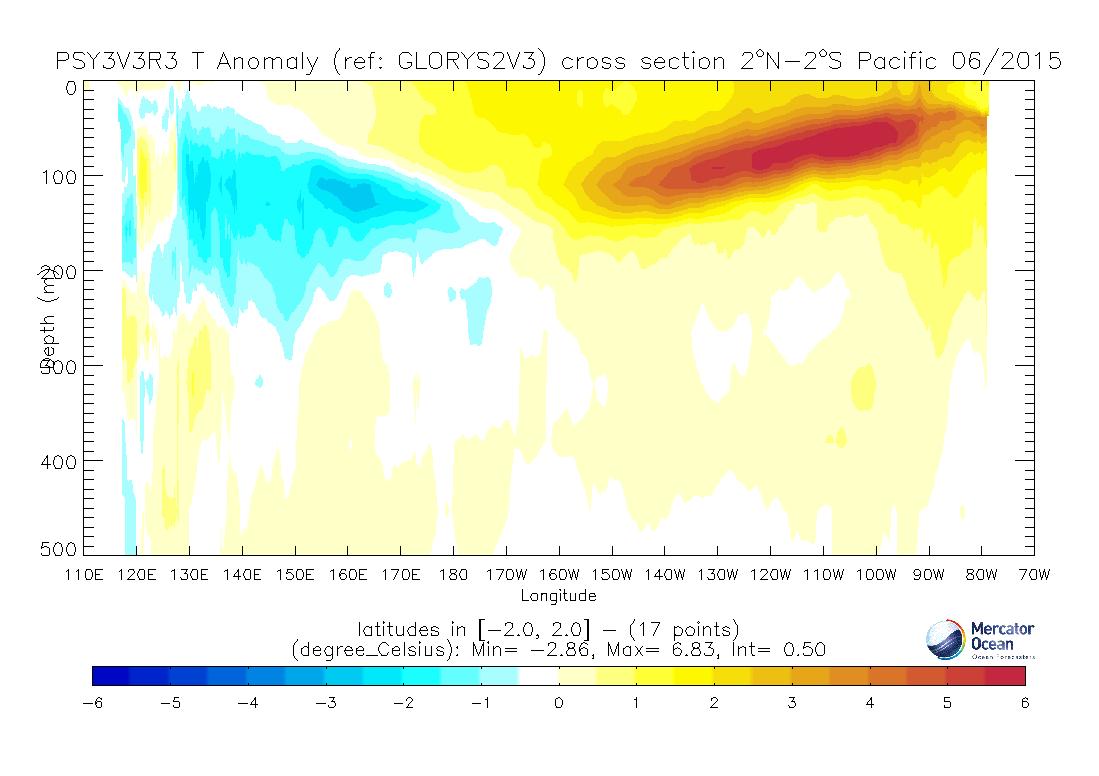
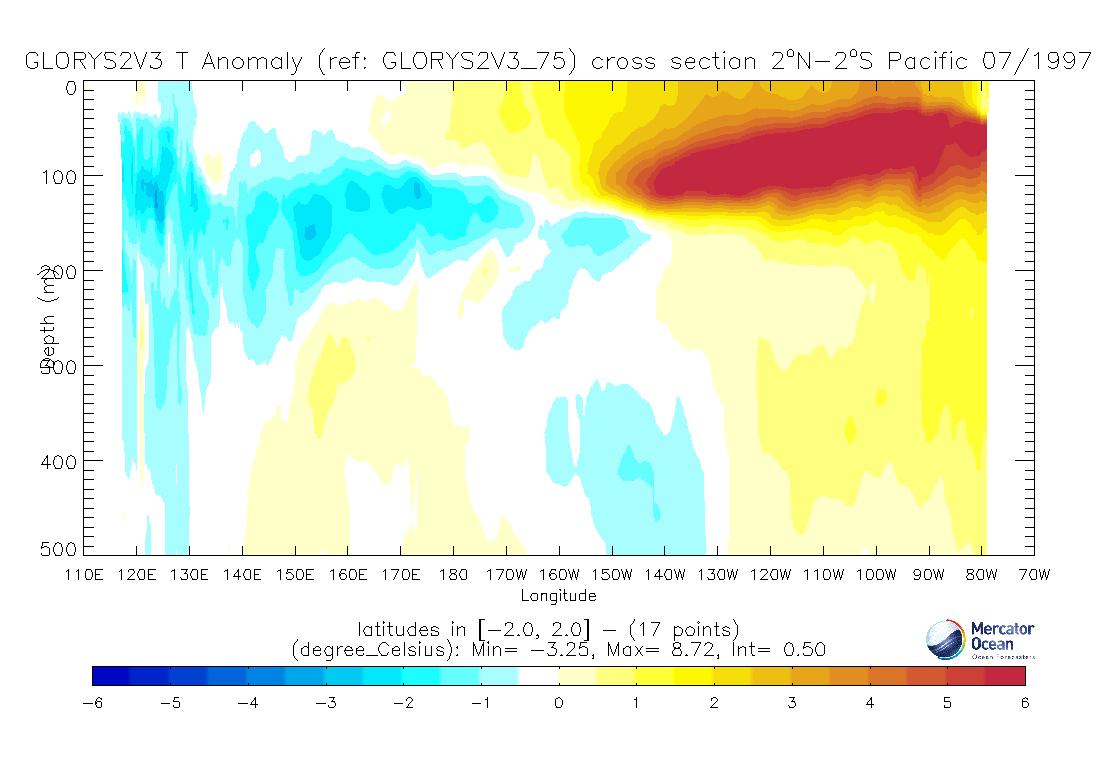
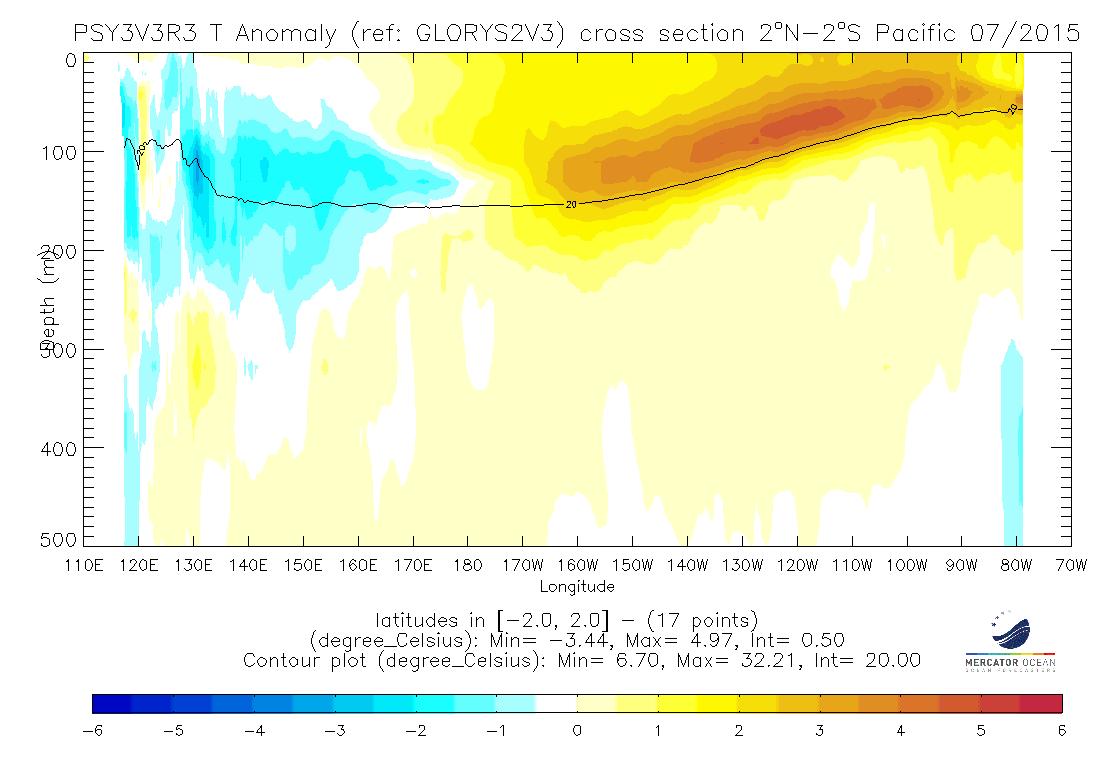
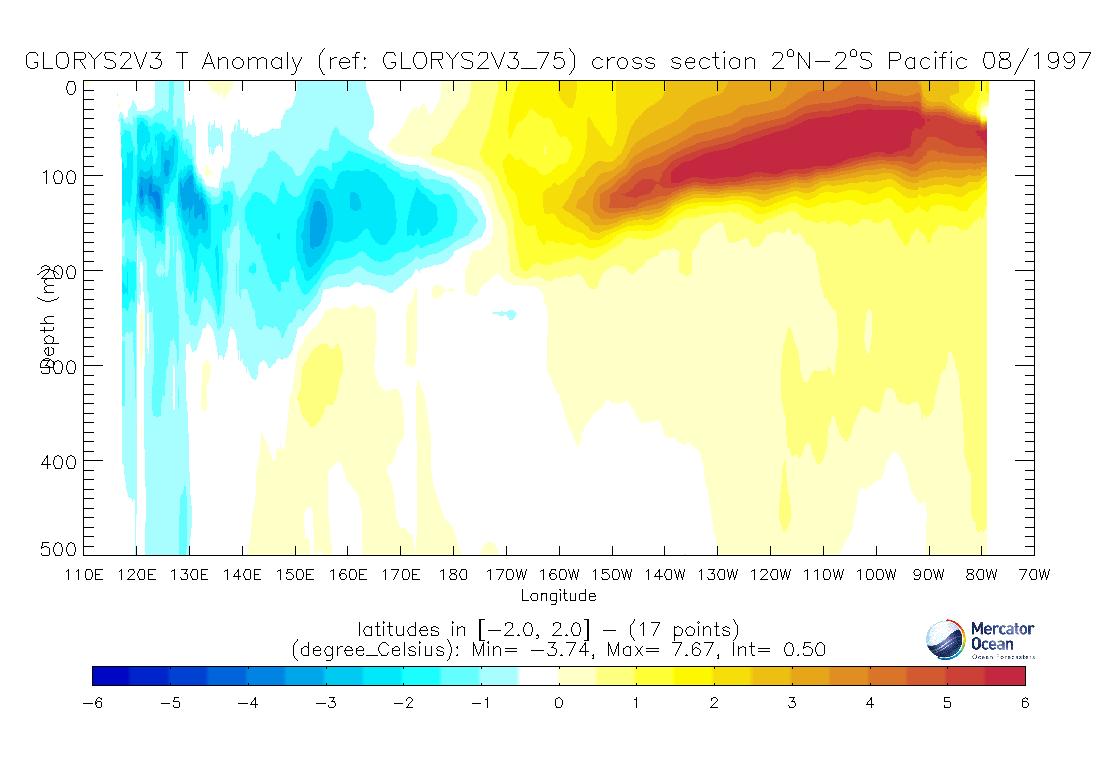
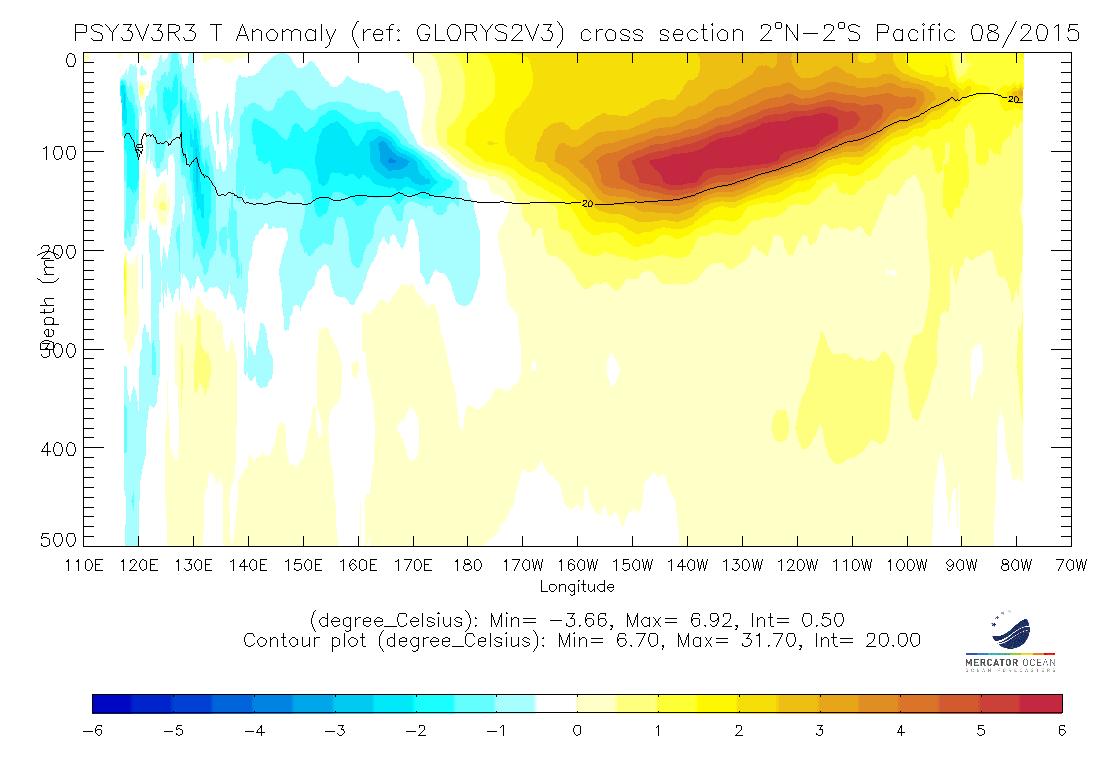
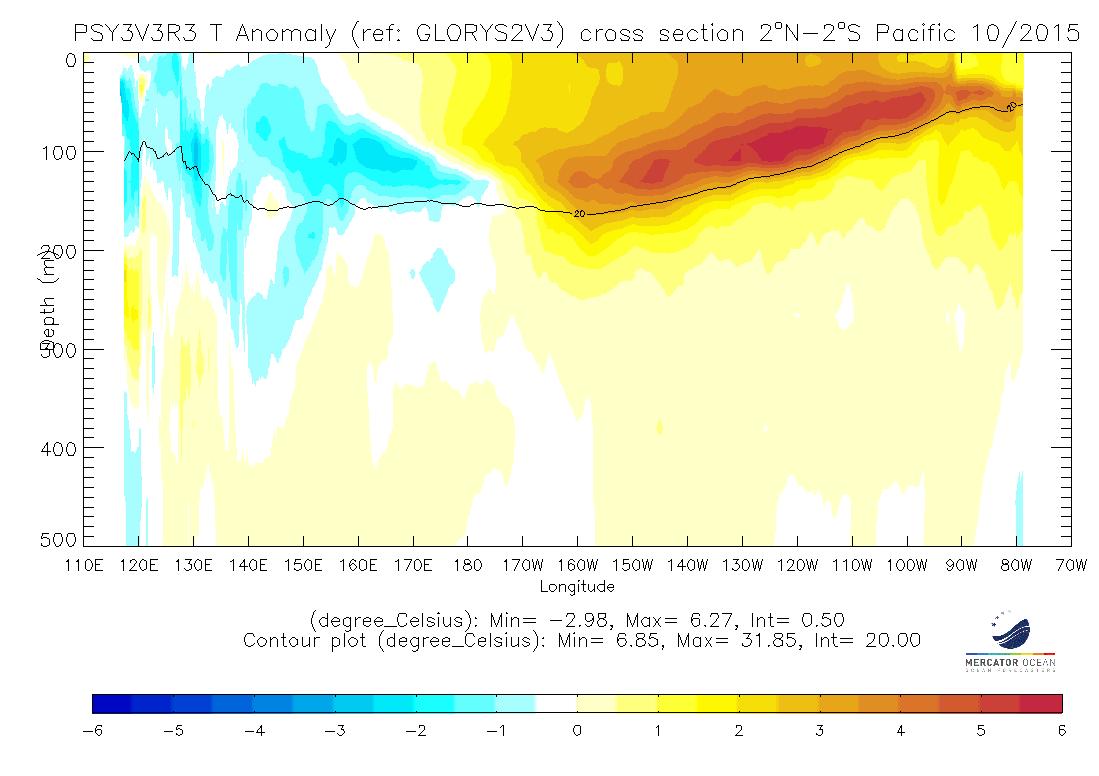
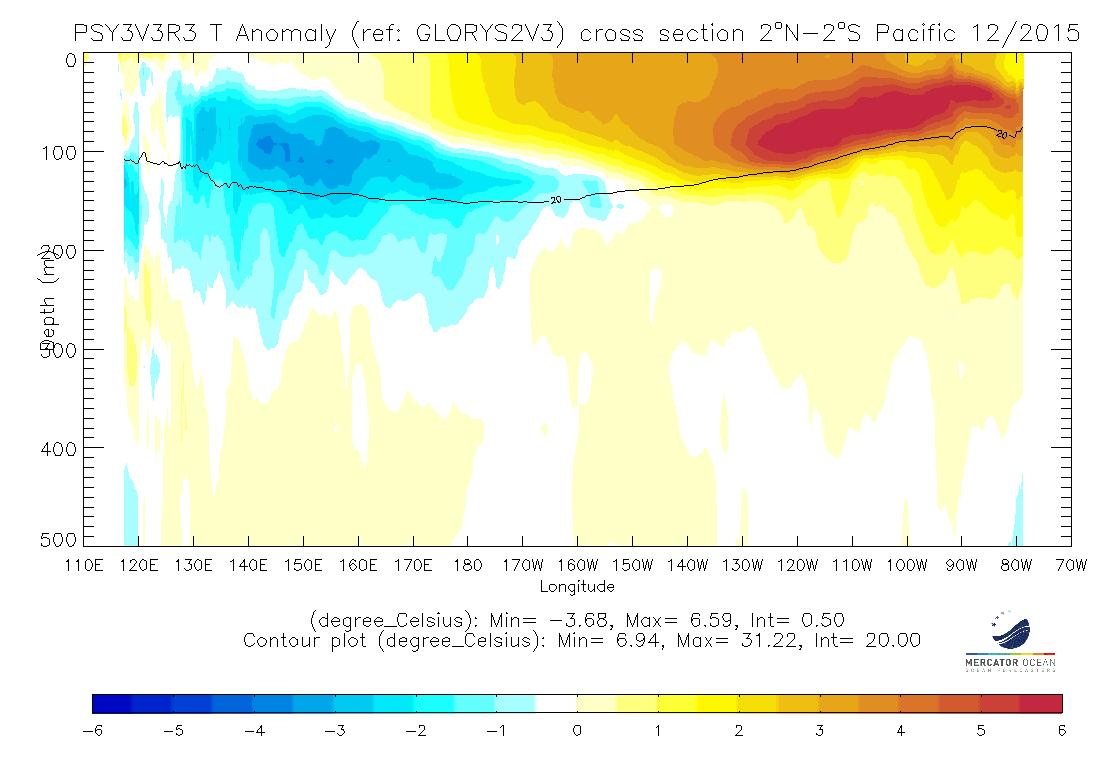
The warm anomalies in the first 300 meters of the ocean (cf. Figure 1) from March to November 1997 and 2015 are similar in the Equatorial Pacific Ocean. A strong El Niño event is present for the end of the year 2015.
For several months, all seasonal forecasting centers provide a strong Niño during end of 2015. Its intensity compared to the 1997 event seems to be a record in particular in the eastern Pacific sea surface temperature.
See the actual Météo-France seasonal forecast bulletin: http://www.meteofrance.com/accueil/previsions-saisonnieres
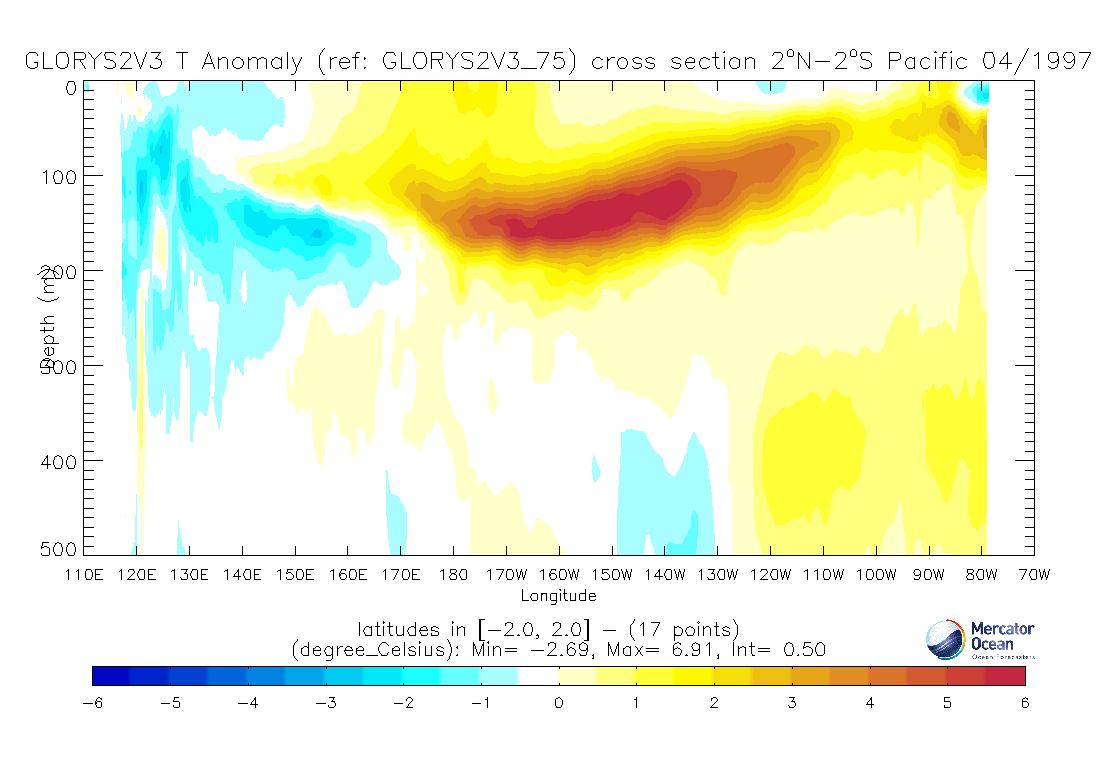
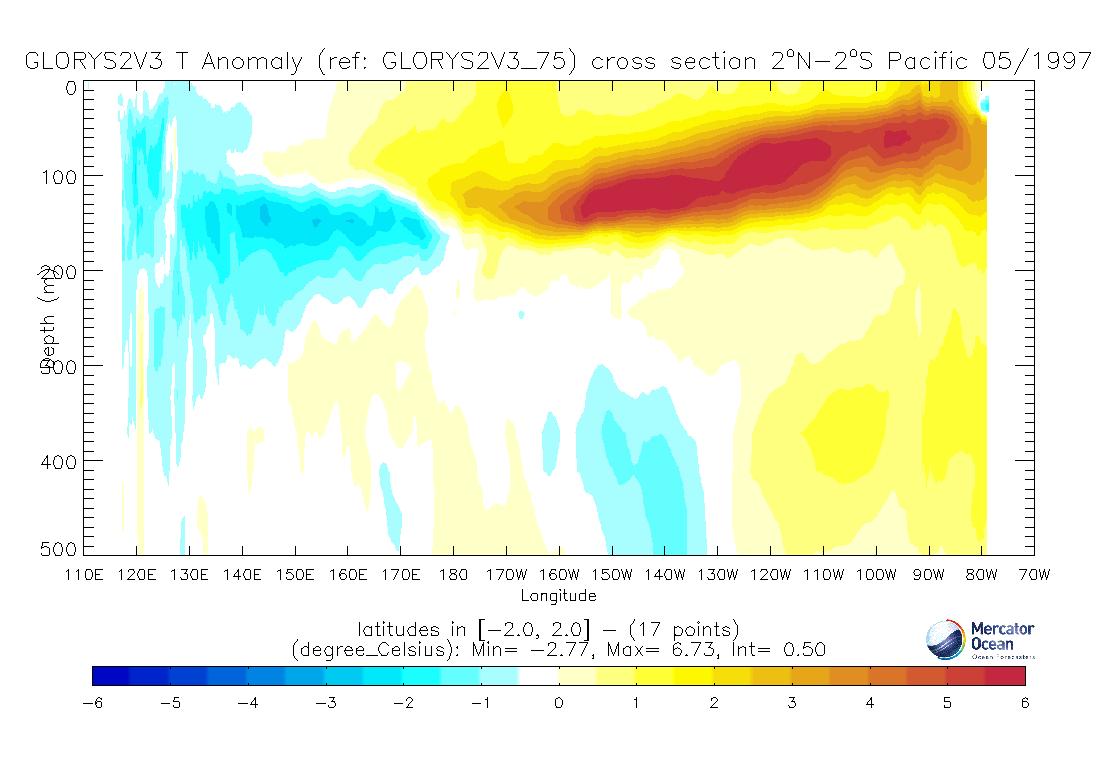
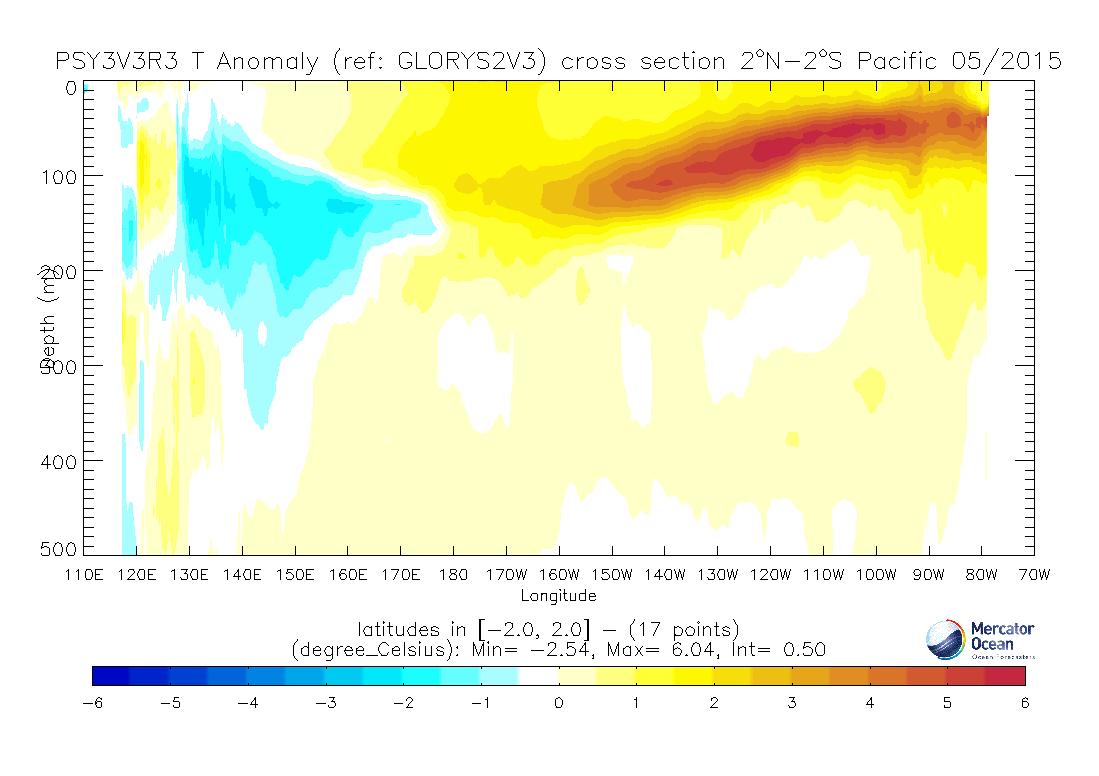
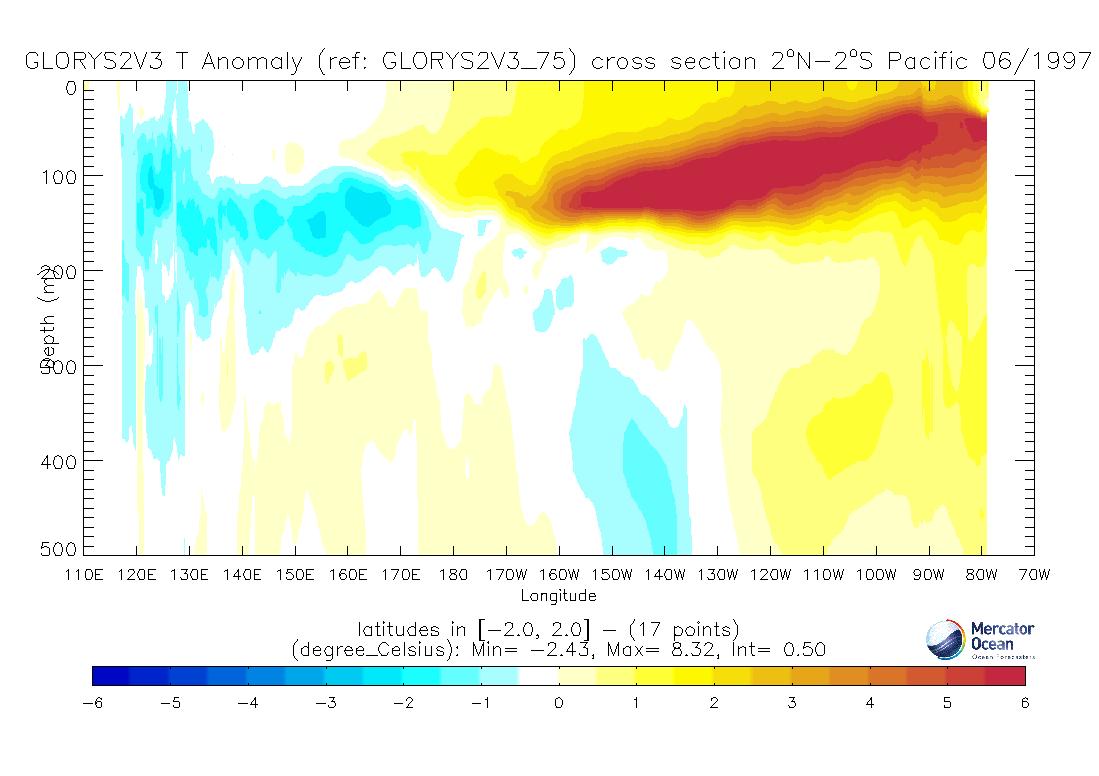
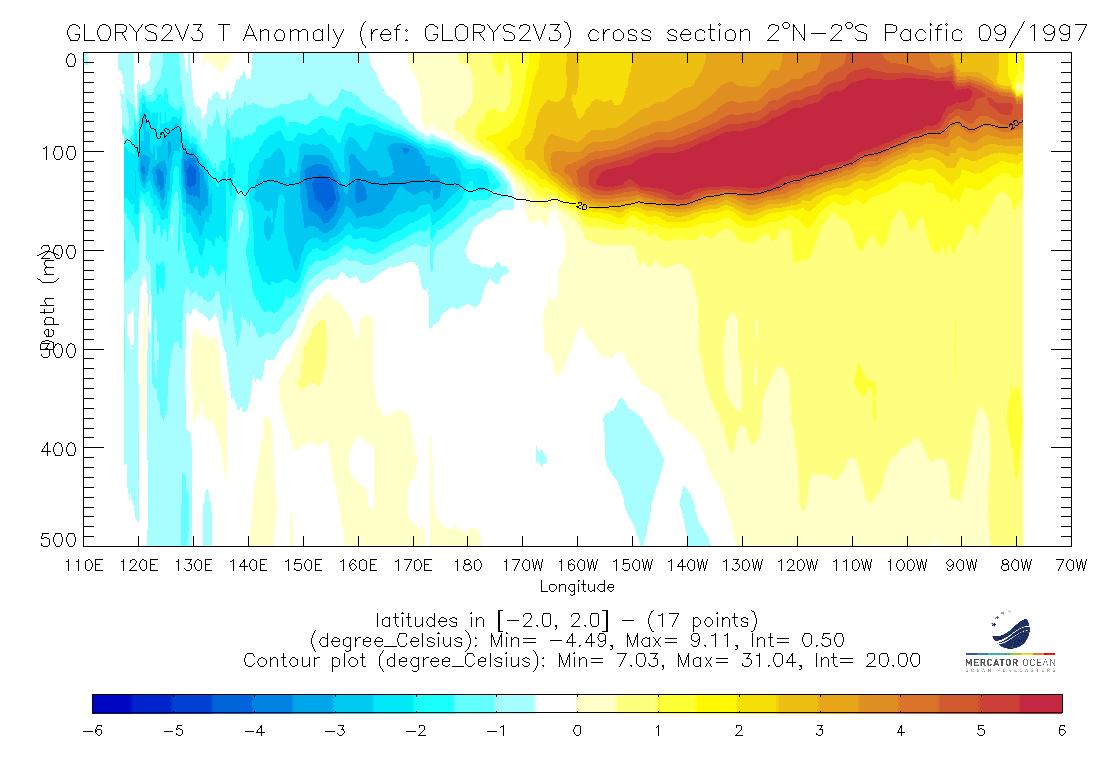
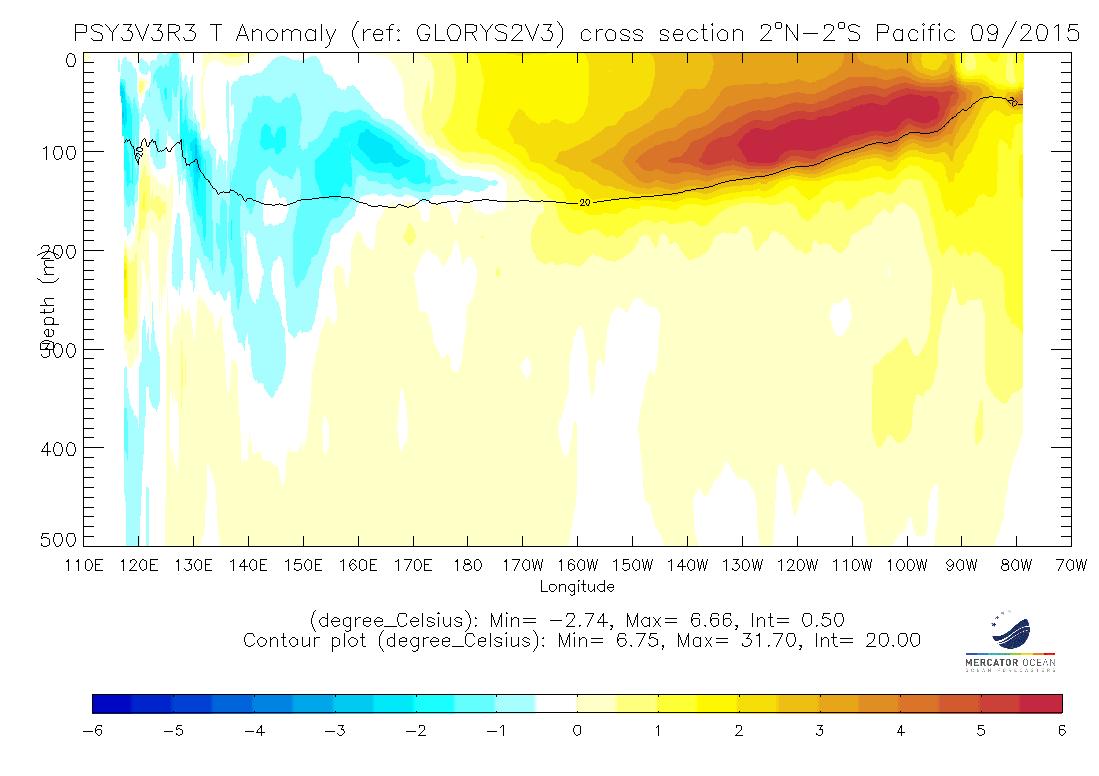
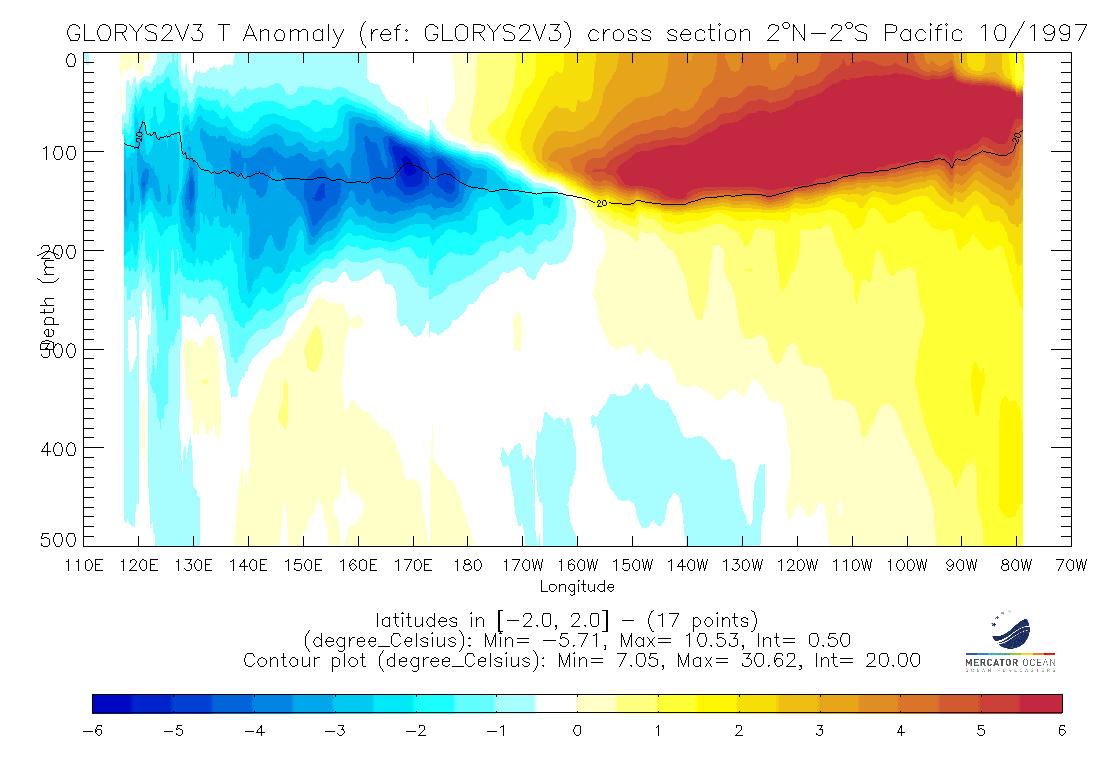
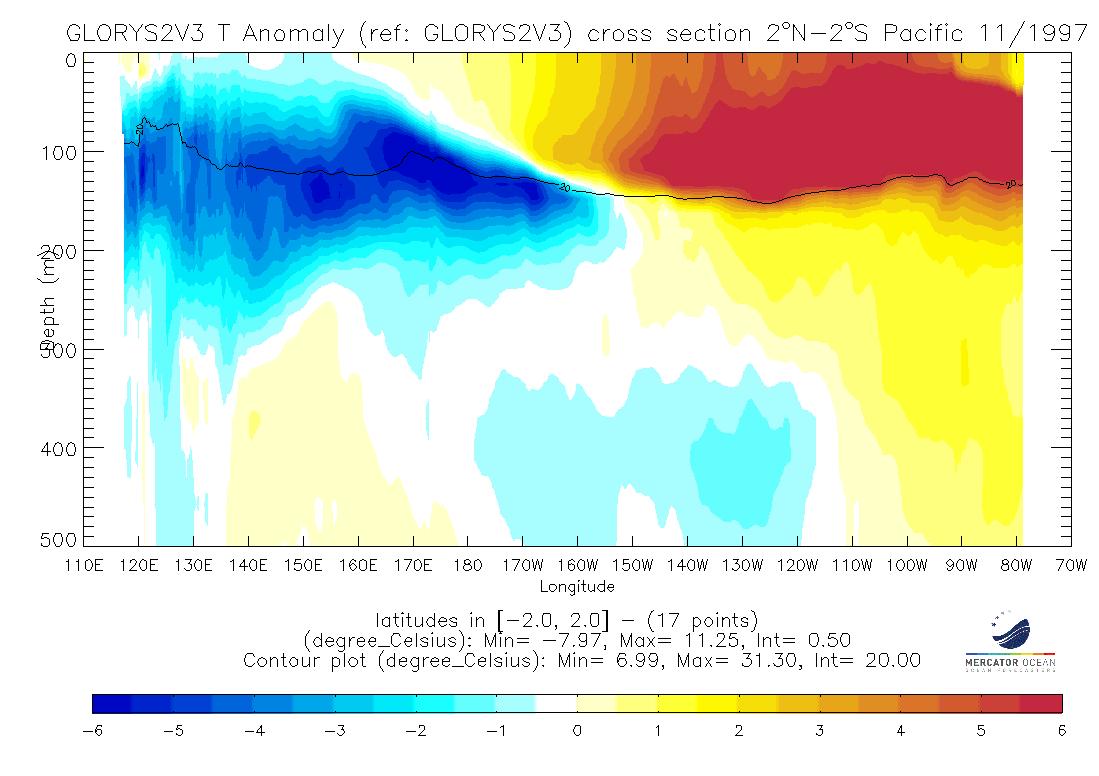
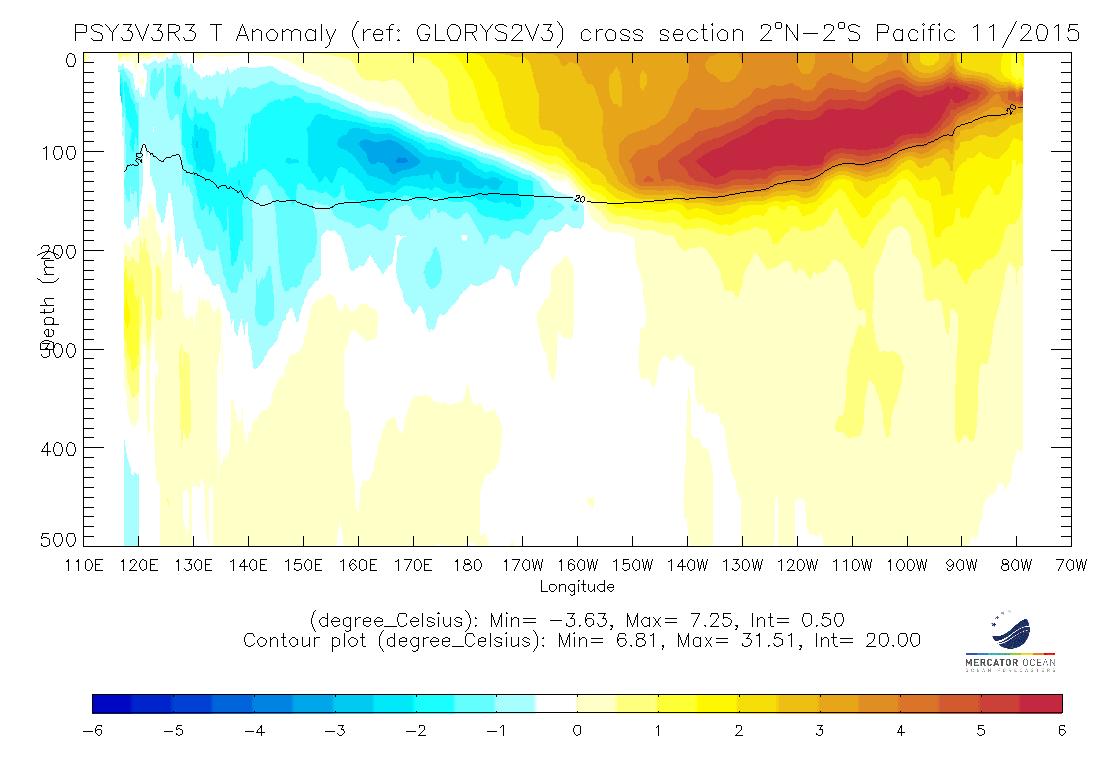
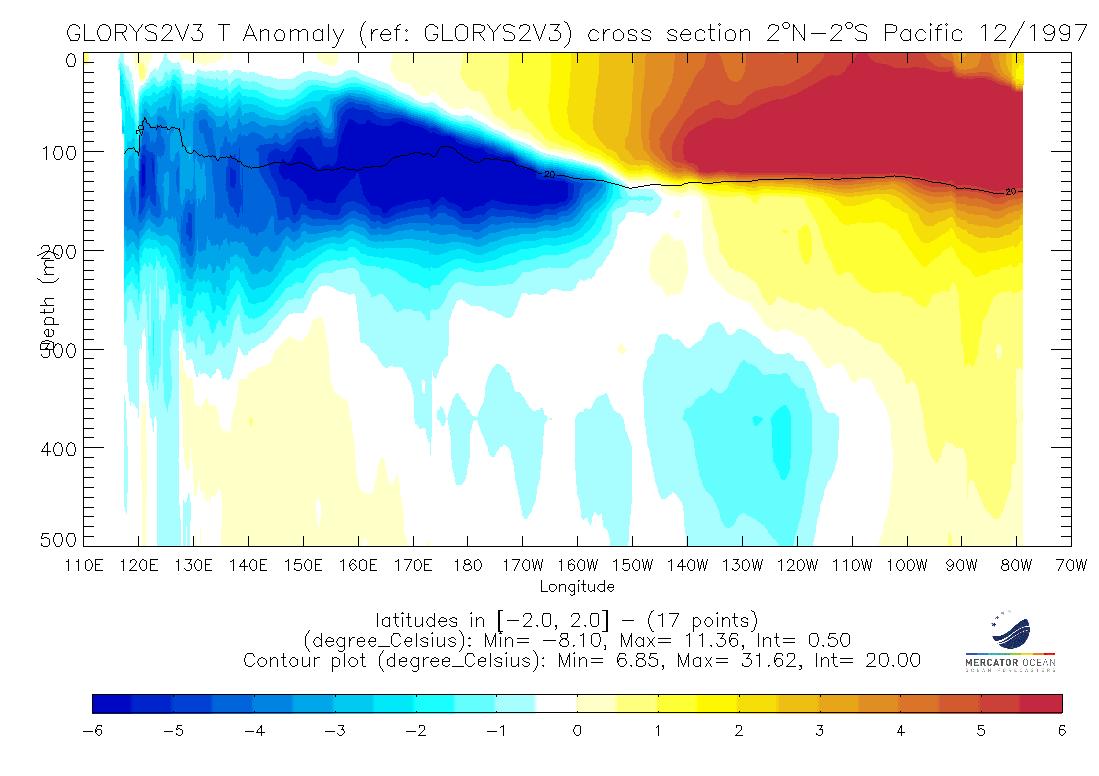
Figure 1: Vertical sections along the equator (2°S-2°N) of the temperature anomalies (monthly mean) in the Pacific Ocean in 1997 with GLORYS (left) and in 2015 with PSY3 (right). In both cases, the reference is the monthly mean GLORYS reanalysis climatology (1992-2013).
March 1997 | March 2015 |
April 1997 | April 2015 |
May 1997 | May 2015 |
June 1997 | June 2015 |
July 1997 | July 2015 |
August 1997 | August 2015 |
September 1997 | September 2015 |
October 1997 | October 2015 |
November 1997 | November 2015 |
December 1997 | December 2015 |
More information:
The Mercator “GLORYS” system (over 1992-2013 period) is a global ocean reanalysis (also called ocean “synthesis” over the past) using the European oceanic model NEMO at 1/4 degree horizontal resolution, with 75 vertical levels. It is forced at the surface by ERA-Interim atmospheric variables. Temperature and Salinity profiles as well as Sea Level Anomalies, Sea Ice Concentration and Sea Surface Temperature are assimilated jointly in a fully multivariate way (one type of observation helps correcting several variables of the model). This ocean synthesis is a consistent description of the ocean state of the past 20 years, using the dynamics of the NEMO model and as close as possible to all available observations of the ocean. The real time global monitoring and forecasting operational system “PSY3” (from 2007 to now) and “GLORYS” use comparable model and data assimilation setups, thus GLORYS can be a useful reference for PSY3 over the past 20 years.
In the ocean temperature estimates of PSY3 we can follow the development of an abnormal warm event in the Pacific Tropical Ocean during spring 2015 that very close to the 1997-1998 El Niño event as seen by GLORYS.
The Figure 1 shows vertical sections along the equator of the temperature anomalies (monthly means) in 1997 and 2015. In both cases, from March to November, waters warm-up (positive anomaly in red with above model’s climatology values around 4-6°C) under the surface between 100 and 200 meters depth, and the warm anomaly progressively propagates to the Eastern side of Pacific Ocean. Conversely, a cooling (negative anomaly in blue) appears in the Western part, signature of the relaxing of the western Pacific warmpool.
A basic indicator to follow the development of El Niño events is the evolution of warm anomalies of sea surface temperatures in the equatorial Pacific Ocean.
Thus Figures 2 (a) and (b) present the interanual variations of sea surface temperature anomalies in the Nino 3.4 box (170°W – 120°W, 5°S – 5°N) over the period 1992-2015. Figure 2 (a) shows the entire time series and Figure 2 (b) shows only the comparison between years where a warming has been observed between January and April in the Nino 3.4 box.
In these figures the El Niño event in 1997 appears rather as a major event. The ends of years 2002, 2006 and 2009 were also marked by a characteristically surface warming of an El Niño. The year 2015 takes the same orientation as in 1997. But only centers of seasonal forecasts as Météo-France can follow the evolution of this indicator over the coming months, with forecasts of their ocean/atmosphere coupled systems, and can predict the importance of this El Niño.
Figure 2 (a)
Figure 2 (b)
Figure 2: (a) Interanual variations of sea surface temperature anomalies in the box Niño3.4 (located in the east-center of equatorial Pacific Ocean) over the 1992-2015 period and (b) comparison of theses anomalies only for years where a warming was observed between January and April at bottom (b). GLORYS simulation over 19923-2013 and PSY3 over 2014-2015. In both cases (a) and (b), the reference is the monthly mean GLORYS reanalysis climatology (19923-2013).
|
|
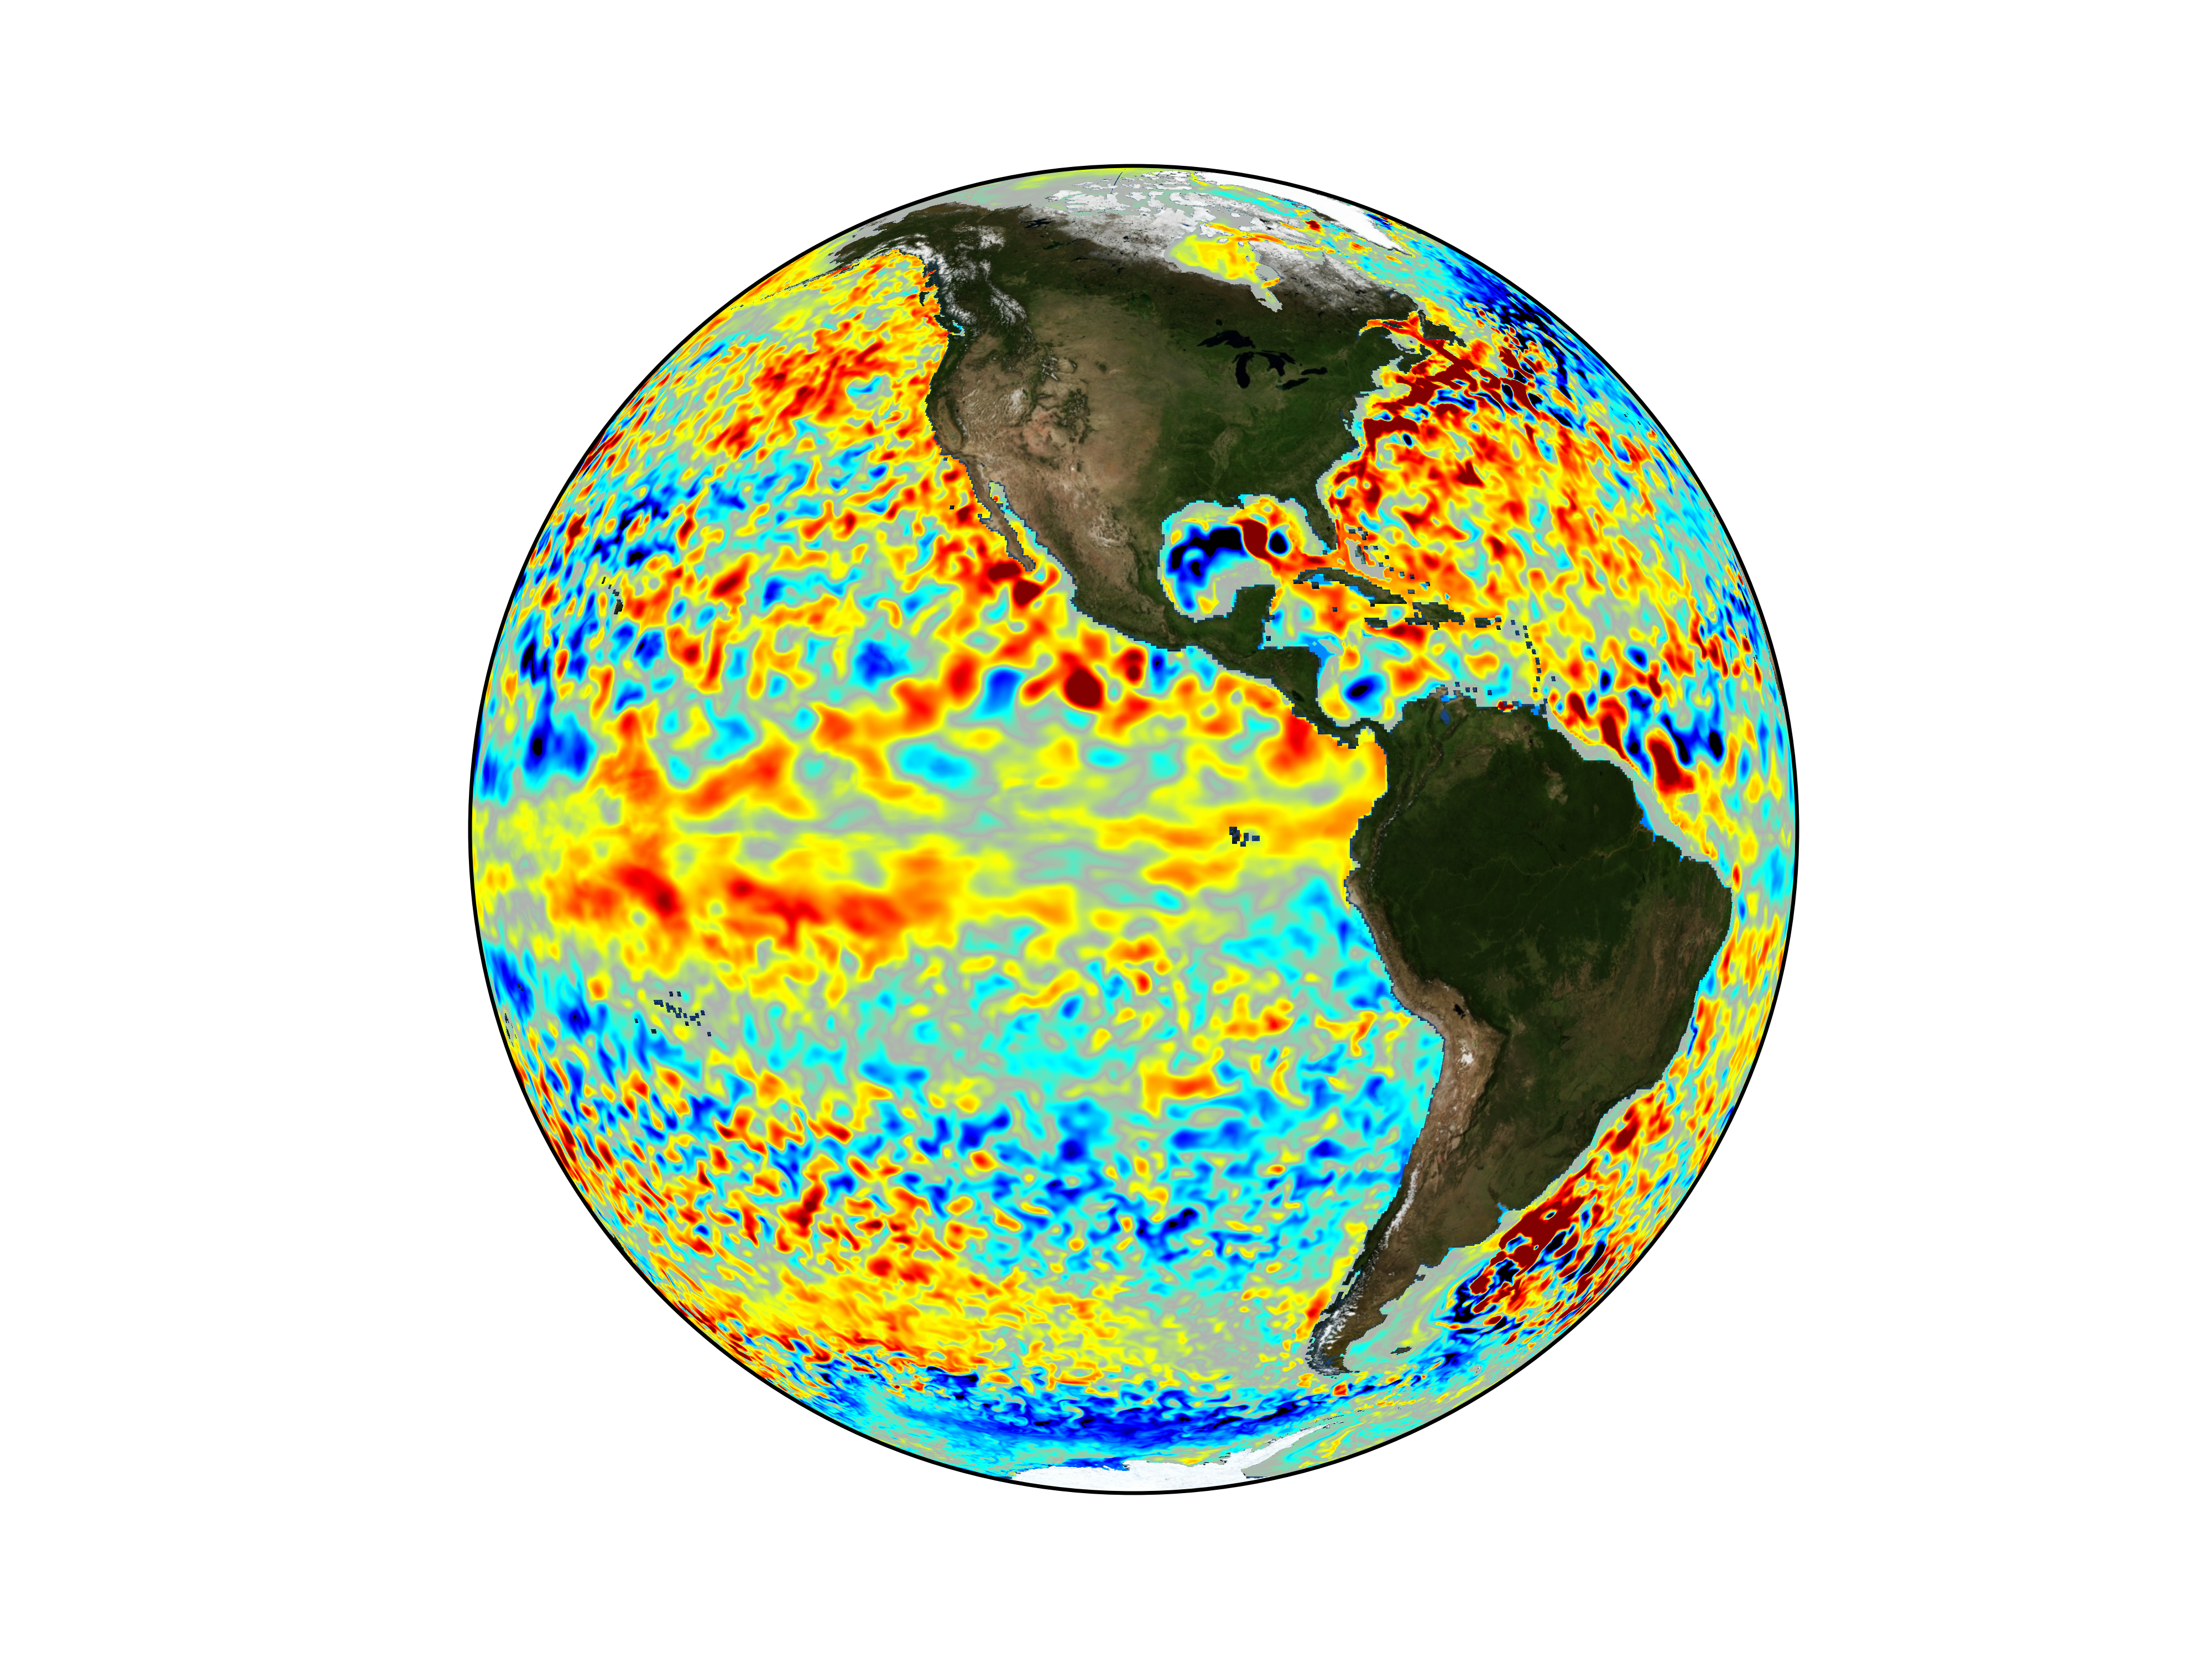
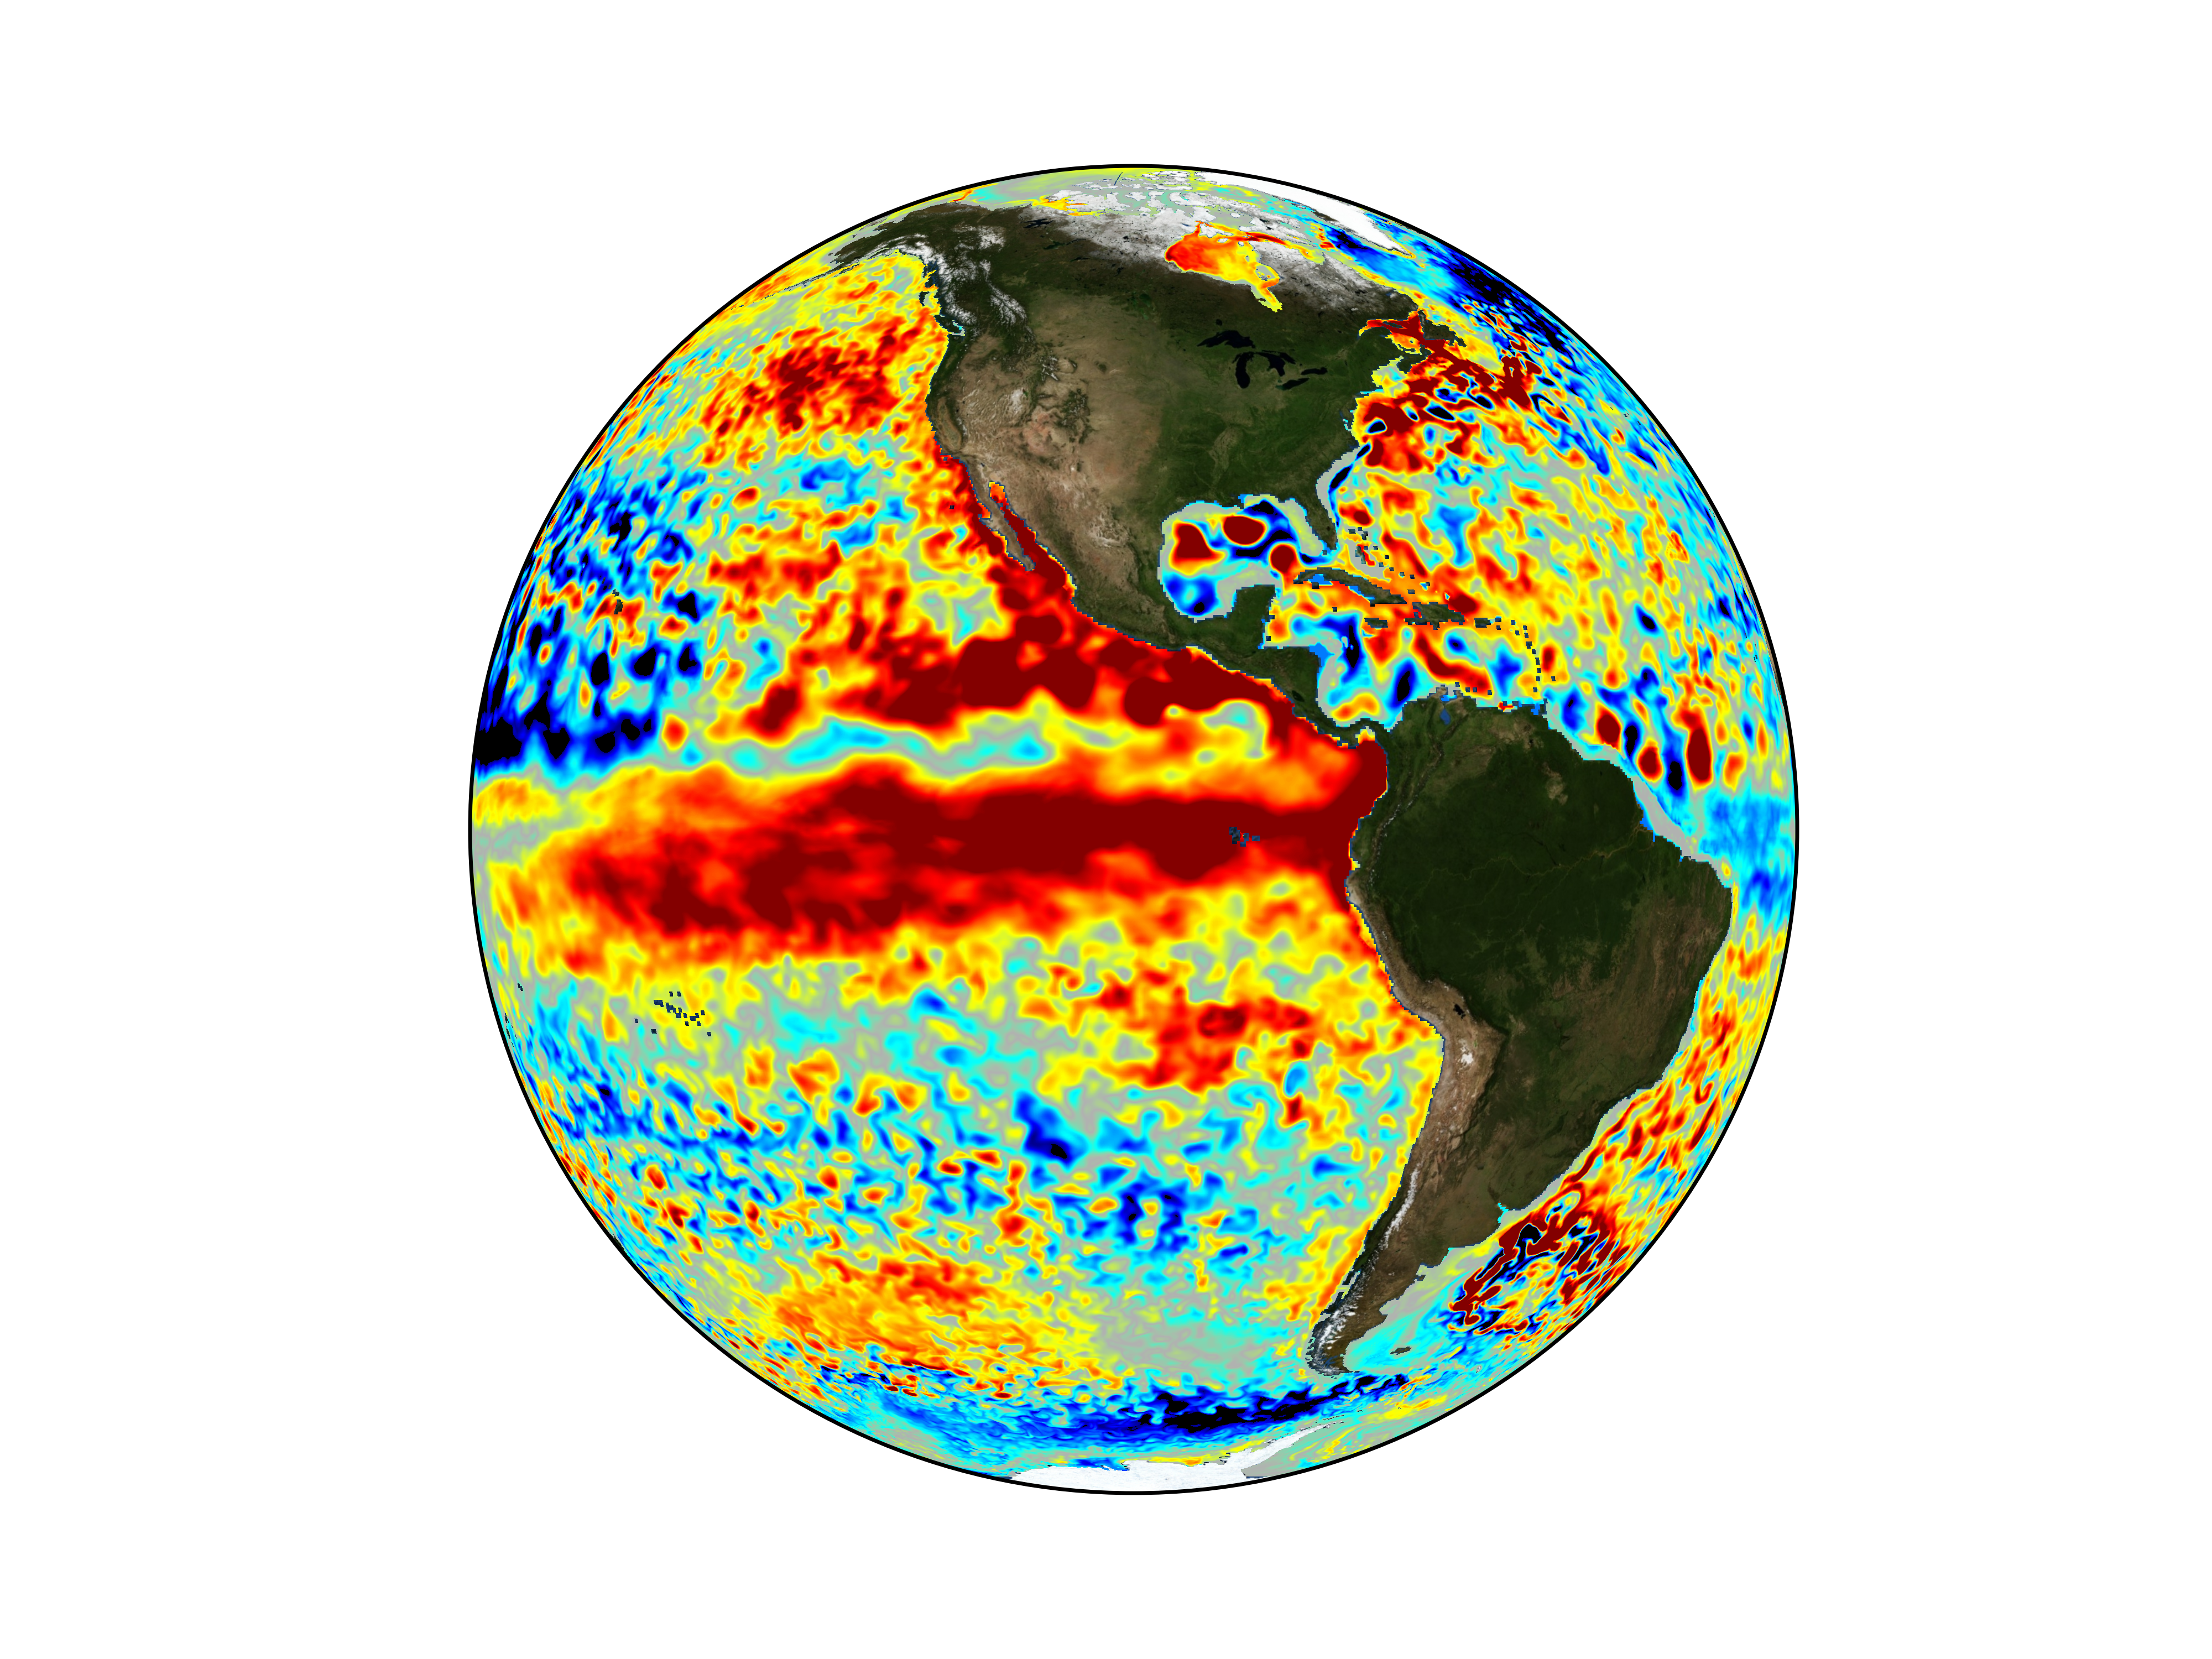
Pacific Ocean heat content - January 3rd 2015 (300 first meters deep) | Pacific Ocean heat content - September 29th 2015 (300 first meters deep) - The map shows in red areas where the heat content is higher than average and in blue, areas where it's lower than average. |
Read also: